GameCo - Video Game Sales
GameCo is a new video game company with markets across the globe. They want to understand market trends to inform the development and marketing of new games.
-
As a data analyst, my goal was to analyse regional sales trends to support GameCo in making data-driven decisions.
-
Are certain types of games more popular than others?
Have any genres decreased or increased in popularity overtime?
How have sales figures varied between geographic regions overtime?
-
Historical sales of video games that have sold over 10,000 copies between 1980 and 2020 - from VGChartz.
-
All data cleaning, wrangling, and analysis was carried out entirely in Excel.
PowerPoint was used to compile visualisations and findings in a final presentation.
-
This is a project I completed as part of the data analytics course at CareerFoundry.
Approach and Process
Data Preparation
Conducted an exploratory analysis to find and address inconsistencies, duplicates, and missing values.
Calculated simple descriptive statistics (averages, maximums, minimums, counts, etc.) to aid in identifying incomplete data and thus refine the range of data to be analysed.
Comparison of original data to cleaned data with easy-to-read formatting and filters to make analysing the data more accessible.
Data Analysis
Pivot tables were used to group and summarise data by region, genre, and publisher. Calculated fields were also created to obtain percentages of the market share in each region.
Filtering options were utilised to focus on relevant years with consistent data.
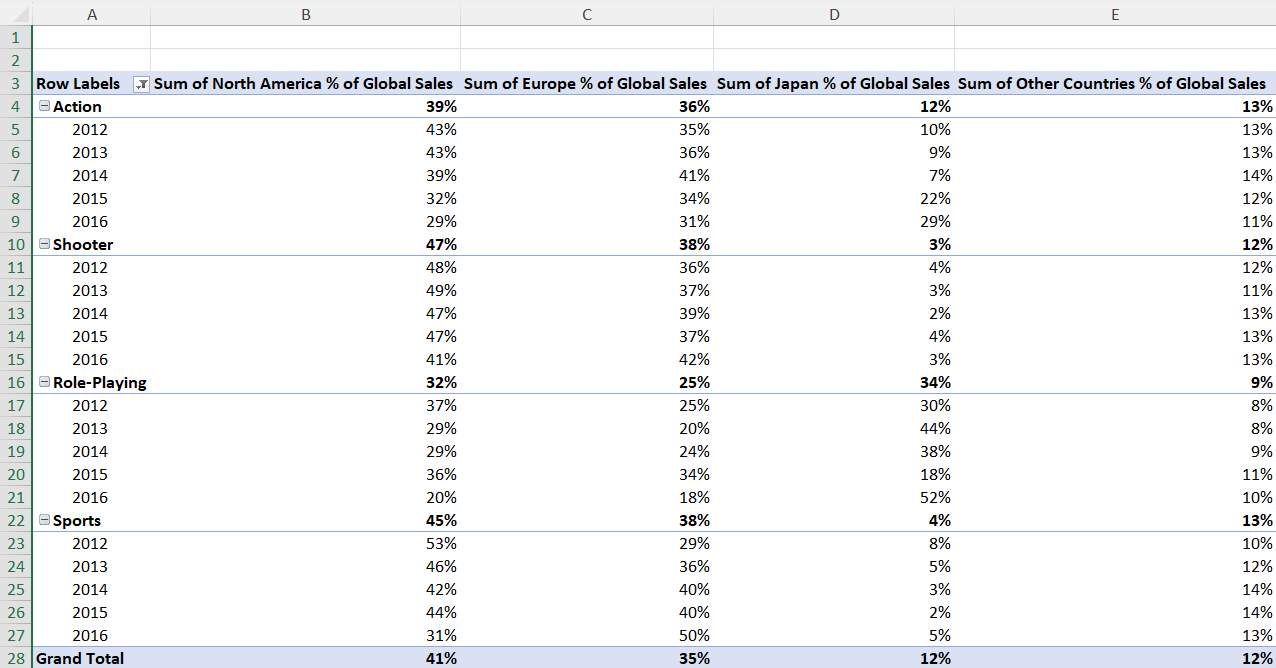
Pivot table showing percentages of sales in each genre across geographic regions between 2012 and 2016.
Visualisations and Presentation
Created doughnut charts, line charts, and 100% stacked column charts to visualise market trends overtime and between geographic regions.
Utilised advanced formatting options in PowerPoint to construct clear data visualisations and communicate findings to stakeholders.
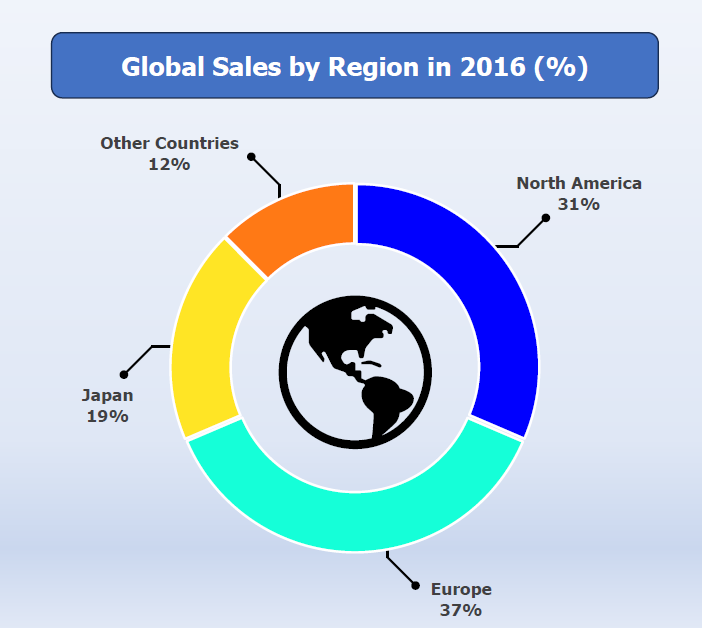
Doughnut chart showing global sales distribution in 2016.
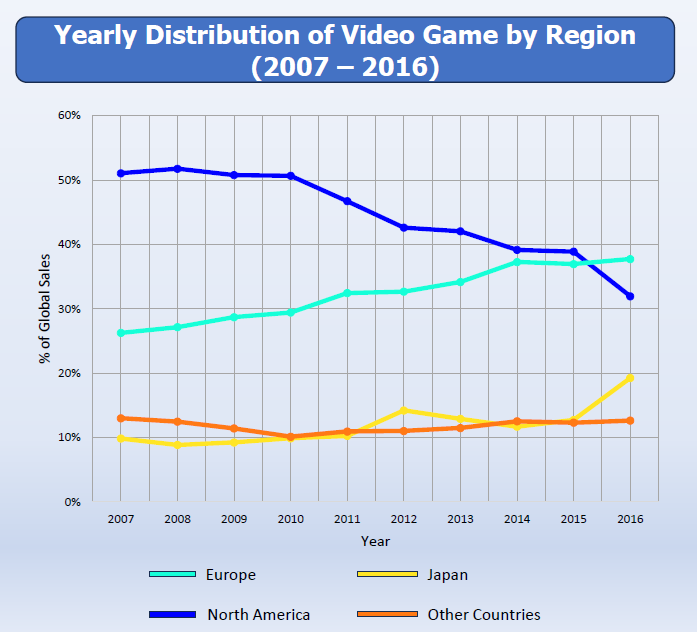
Line chart showing market shifts across different geographic regions.
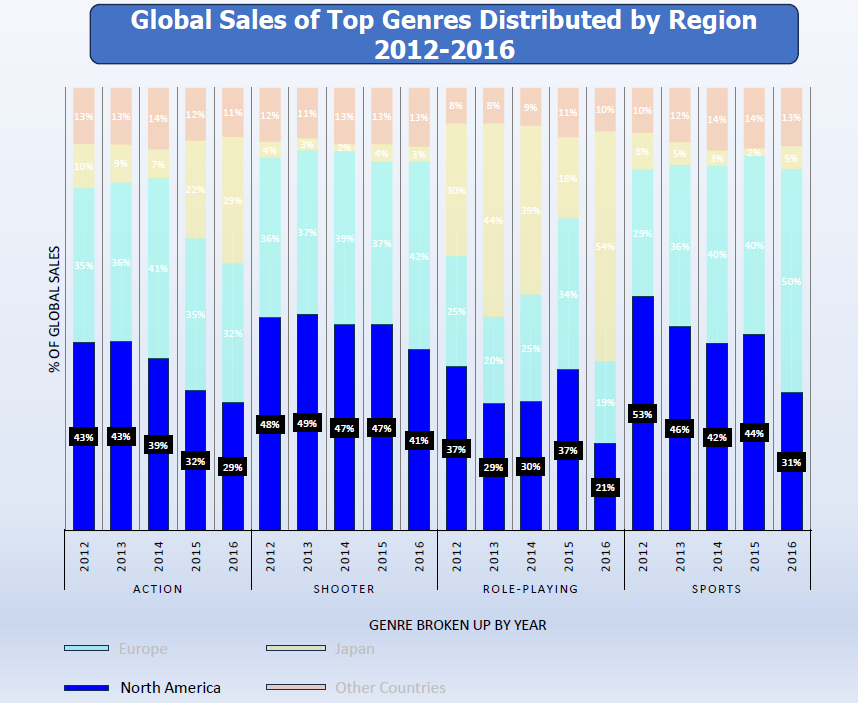
100% stacked column chart showing changes in sales proportions of the top 4 genres across different regions between 2012 and 2016 (advanced formatting used to focus on the North America region).
Results and Deliverables
Summary of Results
Found that video game sales in North America have been declining and recommended increased marketing to counteract the decline.
Identified sport and shooter games growing popularity in Europe. Also, Europe has overtaken North America as having the greatest sales numbers in all regions.
Highlighted a recent boom in the action and role-playing genres in Japan, and this should be marketed more to captialise on the growth.
Deliverables
Excel Report: containing cleaned data, pivot tables, and charts.
Final Presentation: summarising key findings and recommendations to GameCo.
Project Reflections Document: outlining analytical processes which lead to each insight.